
America’s fiscal accounts
Three kinds of red ink
The fiscal-year accounts are easier to understand once annual borrowing, outstanding debt and interest payments are kept apart
America’s pension adjustment shows why the inflation rate on the news is rarely the one in a household budget
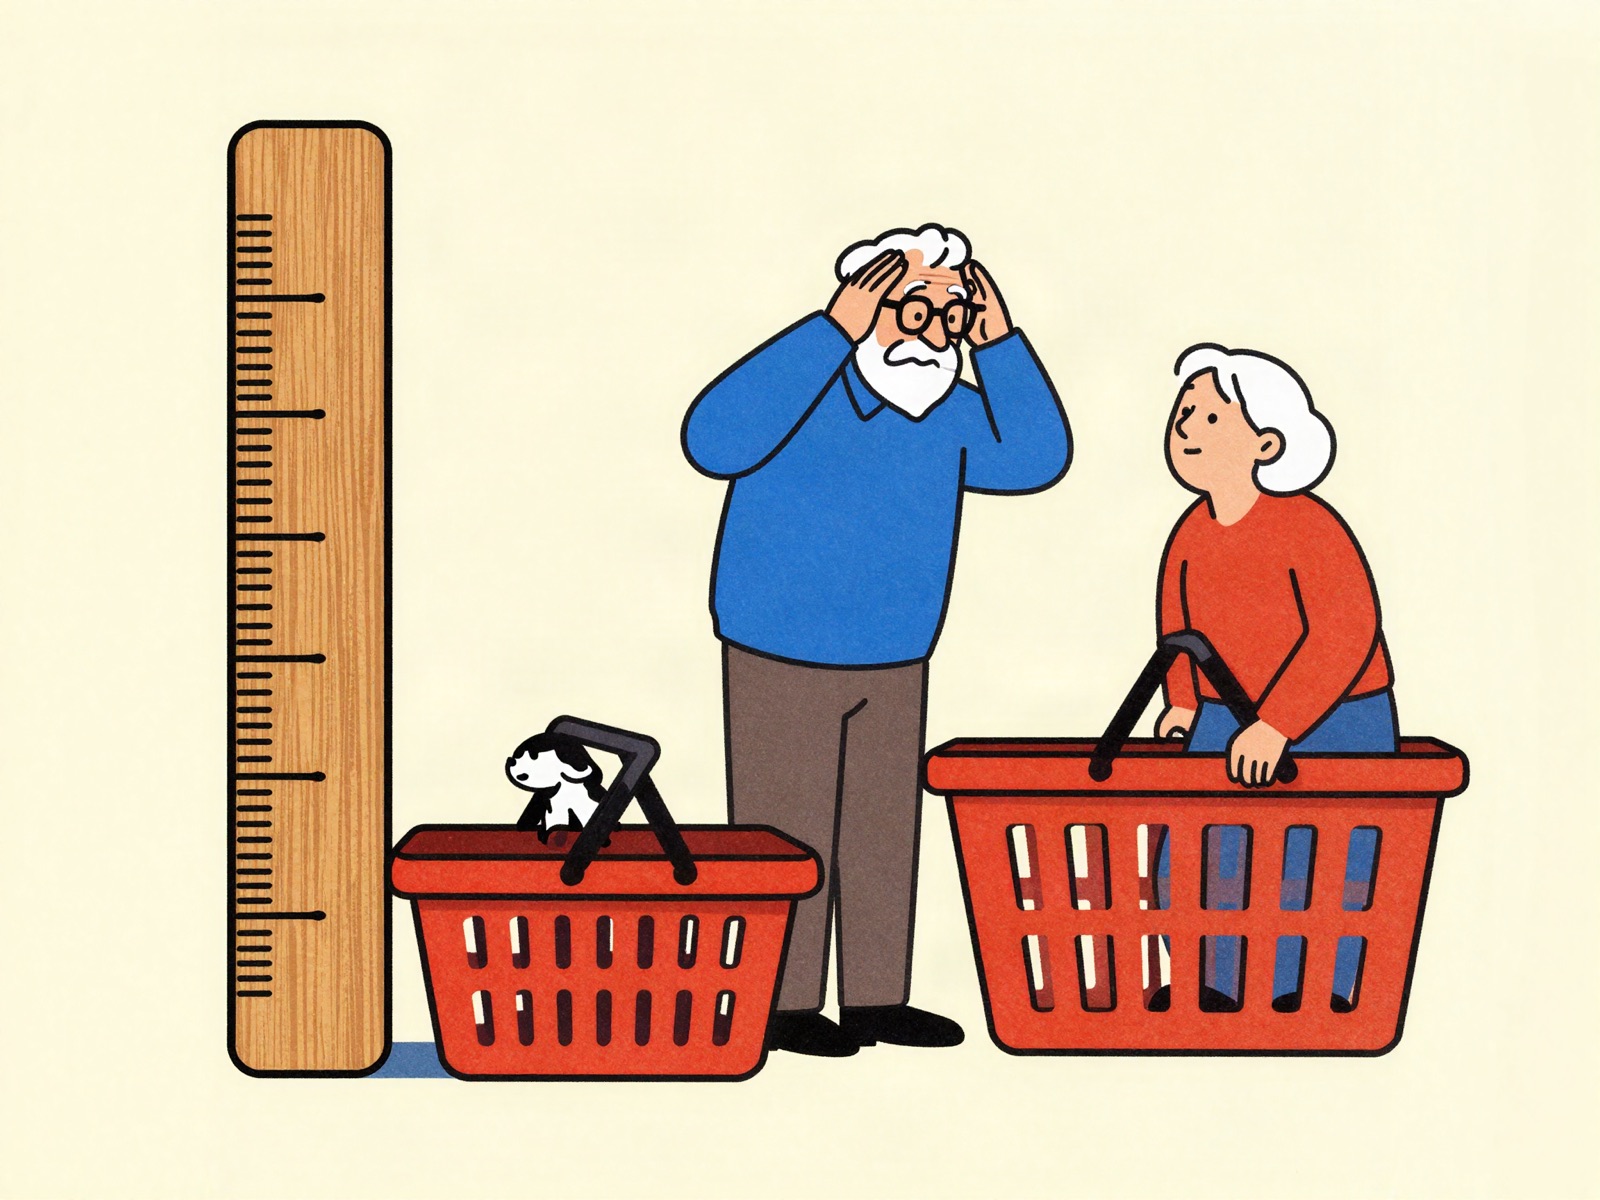
An inflation announcement can produce several correct numbers and still leave people convinced that one of them must be wrong. On October 14th America’s Social Security Administration announced a 3.6% cost-of-living adjustment for 2027, the largest since 2023. The same day, the Bureau of Labor Statistics reported that consumer prices in September were 3.7% above their level a year earlier. The difference is small. The questions it raises are larger: whose prices, measured over which period, and with what purpose?
The pension adjustment, known as the COLA, follows a statutory formula. The headline inflation rate describes a different statistical comparison. Neither promises to match the change in every recipient’s bills. Understanding the distinctions is more useful than asking which figure is the “real” rate of inflation.
The COLA calculation uses the Consumer Price Index for Urban Wage Earners and Clerical Workers, or CPI-W. It compares the average index for the third quarter with the corresponding average in the most recent year in which a COLA took effect. For this adjustment, that means comparing July, August and September 2026 with the same quarter of 2025. The resulting percentage increase is rounded to the nearest tenth of a percentage point.
The familiar headline figure usually comes from the broader Consumer Price Index for All Urban Consumers, or CPI-U. September’s annual rate compares the September index with the index in September of the previous year. It is a point-to-point comparison, whereas the pension formula compares quarterly averages. Even if both calculations used the same population, they could differ when prices accelerated or slowed during the quarter.
There is another distinction inside the monthly inflation release. A seasonally adjusted month-on-month change attempts to remove recurring calendar patterns. The annual headline comparison normally uses unadjusted data. Multiplying a monthly percentage by twelve will therefore not reproduce the published annual rate. Compounding matters, and the months being compared matter more.
The CPI measures average price changes using expenditure weights. A category on which the covered population spends more has more influence on the result. CPI-W and CPI-U draw on much of the same underlying price information, but represent different populations and spending patterns. The pension formula’s reference to wage earners does not mean that every pensioner shops like a currently employed household.
Nor does any national index describe a particular home. Someone who drives long distances is more exposed to petrol prices than someone who walks to work. A household with large medical expenses has a different budget from one whose spending goes chiefly on food and transport. Even neighbours with similar incomes can experience different changes in their cost of living.
This is not a defect that a bigger sample can entirely cure. A national average answers a national question. Turning it into a personal budget requires information about quantities purchased, local prices and individual circumstances. The statistical agency can improve the measurement of the average without making every household resemble it.
Consider a deliberately simplified illustration. Suppose half a household’s budget goes on a category whose prices rise by 6%, and half on a category whose prices are unchanged. Holding quantities fixed, the cost of that basket rises by 3%. A household spending almost everything on the first category faces a much larger increase. These are invented baskets, not estimates of American spending; they show why weights are as important as prices.
The announced adjustment applies to Social Security benefits payable in January 2027. It responds to an already observed period of inflation. It does not forecast the prices recipients will face throughout the following year. If inflation accelerates after the measurement window, the adjustment initially lags. If inflation slows, the increase can look generous relative to a later annual reading even though the formula has not changed.
That lag matters for people with little financial room to absorb a sudden rise in bills. An annual adjustment smooths administration, but households buy necessities throughout the year. A statistical promise to preserve purchasing power over time does not ensure that cash arrives when a particular expense rises.
There is also a basic confusion between inflation and the price level. When inflation falls, prices usually continue rising, only more slowly. A lower annual rate does not return the supermarket bill to its old level. Once a price increase has entered the index, it remains part of the higher starting point unless prices subsequently fall. A household can therefore feel squeezed even while inflation statistics improve.
The useful questions are precise. Which index does a contract or benefit formula specify? Does it compare individual months or averages? Is the figure an observed change or a forecast? Does an increase refer to a gross entitlement or the cash ultimately received after deductions? Each question prevents a different misunderstanding.
For policymakers, the choice of index is consequential because it determines what purchasing power the system attempts to protect. A measure designed around another population might better represent some recipients and worse represent others. That is an argument about the objective of indexation, separate from whether the published calculation was performed correctly.
The October announcement settles the adjustment under the existing formula. It cannot settle whether a particular recipient’s budget has become easier. Inflation statistics are measuring instruments, and instruments are useful when their scale is understood. A number accurate to a decimal place still needs a label.
The fiscal-year accounts are easier to understand once annual borrowing, outstanding debt and interest payments are kept apart

A widening trade gap raises useful questions about demand and financing, but cannot answer them on its own

PepsiCo’s latest results offer a timely way to understand why an earnings release contains more than one version of performance