The Federal Reserve
Back on the brakes
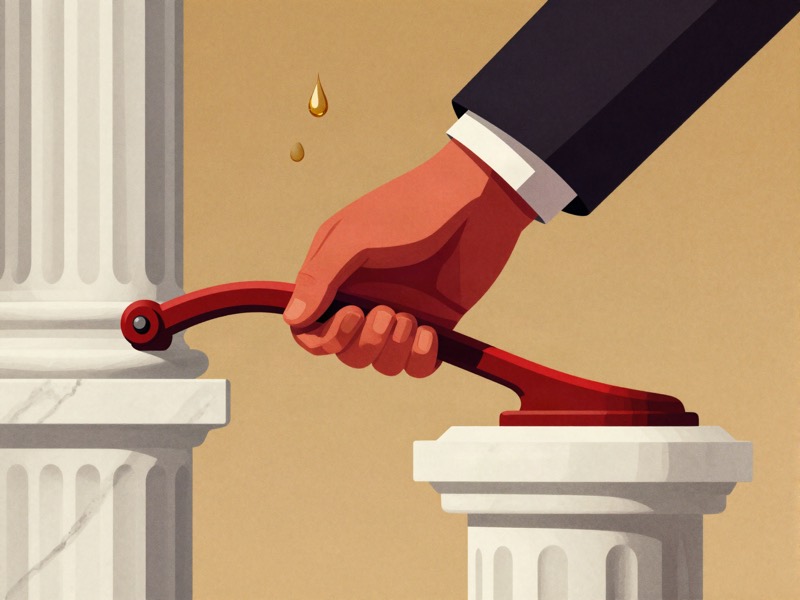
An oil shock has pushed America’s central bank into its first rate rise since 2023. Kevin Warsh may not be done
Seven months after Iran closed the Strait of Hormuz, the bill for the biggest energy-supply shock on record is still arriving
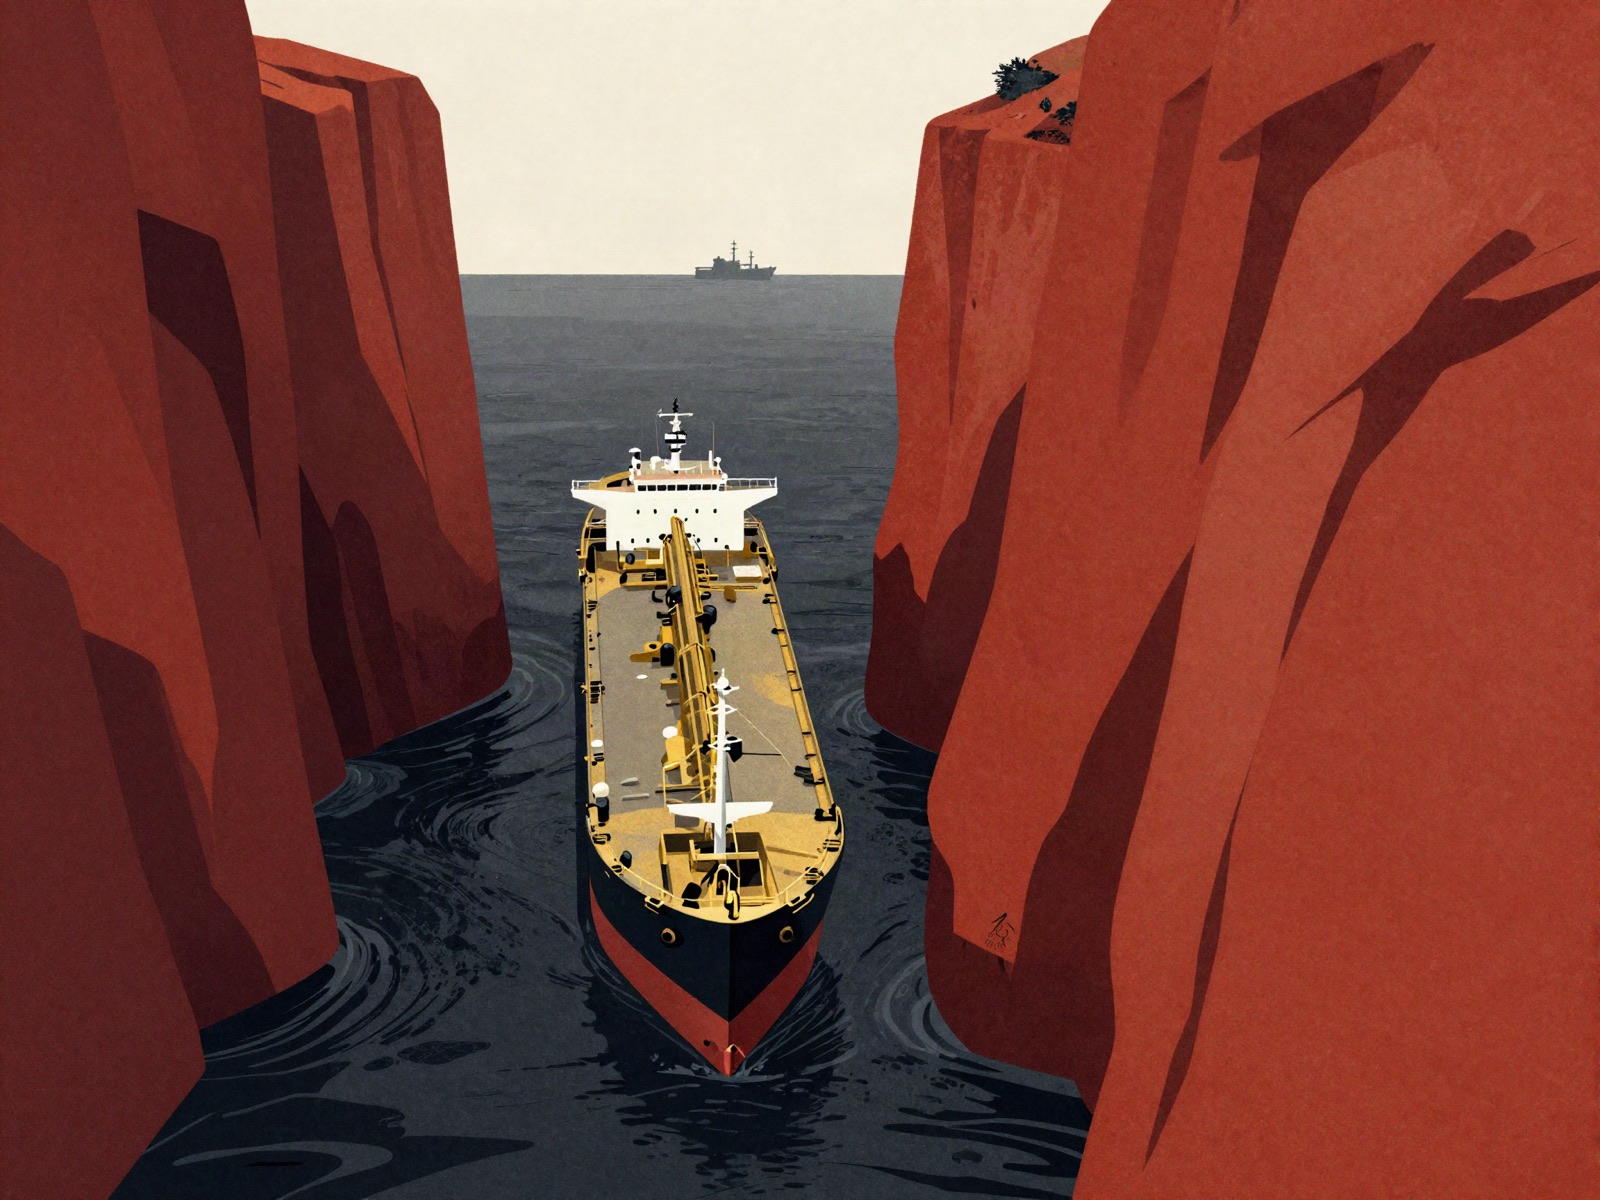
The Strait of Hormuz is about 21 miles wide at its narrowest point. For decades economists described it as the world’s most important chokepoint, mainly in the hope that nobody would ever test the claim. In 2026 somebody did. After American and Israeli strikes on Iran began on February 28th, Iran declared the strait closed on March 4th and began attacking ships that tried to pass. The International Energy Agency calls the result the largest supply disruption in the history of the global oil market.
Roughly a fifth of the world’s oil and about a fifth of its liquefied natural gas (LNG) normally pass through the strait. Markets reacted accordingly. American crude rose by more than 35% in the first full week of March, its biggest weekly gain since futures trading began in 1983. On March 12th, after Iran’s new supreme leader, Mojtaba Khamenei, vowed to keep the waterway shut, Brent crude settled above $100 a barrel for the first time since 2022.
What followed was less a single shock than a series of them. America began an air campaign to reopen the strait on March 19th. A ceasefire brokered by Pakistan in early April briefly raised hopes; on April 13th, after talks in Islamabad failed, America imposed a naval blockade on Iran. Iran declared the strait open on April 17th and shut it again the next day. A memorandum signed in June set out a ceasefire of up to 60 days, but hostilities resumed in early July. In late August Iran and Oman agreed on a temporary shipping route. As of early October Iran was saying the strait would stay closed until America accepted its terms, and reports of attacks on shipping continued.
The result is a market that never fully closed but became very expensive to use. Brent ended trading on October 13th at about $106 a barrel and American crude at about $94. ADNOC, the United Arab Emirates’ state oil company, expects full flows through the strait not to resume until 2027 even if a deal is struck quickly.
Oil gets the headlines, but gas may matter more for the world economy. Qatar, one of the world’s biggest LNG exporters, halted production after drone strikes on its facilities; Goldman Sachs estimated the pause would cut near-term global LNG supply by about 19%. Between February and May, natural-gas prices rose by 44% in Europe and 66% in Asia, according to the World Bank. In America, which produces far more gas than it uses, they fell by 6%.
Source: World Bank. American prices fell by 6% over the same period.
The squeeze has not eased. Asian spot LNG prices jumped from about $17 to $22 per million British thermal units in a single week in July, according to Kpler, a data firm. In early October, with LNG traffic through the strait down by roughly 80% and Qatar extending force majeure on some exports, global spot prices hit their highest since late 2022. Kpler now assumes LNG transit stays severely constrained to the end of the year.
The geography of pain is lopsided. America is a net energy exporter; its oil and gas producers have hit record share prices, and its consumers, though grumbling about petrol, face nothing like the gas bills of Europe or Japan. Energy-importing economies in Europe and Asia are bearing most of the cost. The IMF’s July forecast cut world growth to 3% for 2026, noting that the shock falls hardest on importers and the most vulnerable economies.
Financial markets felt it too. Global shares fell by almost 10% between late February and the end of March. International stocks, which had been comfortably outperforming America’s at the start of the year, gave back most of their lead, because the regions most exposed to the shock are the ones that buy their energy abroad.
Two things have kept the damage short of a 1970s-style catastrophe. Oil prices, as economists at the European Central Bank have noted, have risen less than the scale of the disruption would suggest, partly because traders expect it to be temporary. And demand has given way: high prices have cut consumption faster than forecasters assumed.
Geopolitics rarely moves markets for long. Elroy Dimson, Paul Marsh and Mike Staunton, who keep the longest global record of investment returns, find no general link between measures of geopolitical risk and future share prices. But they also find that three of the six worst episodes for global equities since 1900 were geopolitical, including the oil shock of 1973-74. The difference between a scare and a crisis is duration. Seven months in, the Strait of Hormuz is closer to the second category than anyone hoped in March.
An oil shock has pushed America’s central bank into its first rate rise since 2023. Kevin Warsh may not be done
America’s tech giants are spending like railway barons. Investors are starting to ask what they will get back

America’s long-term borrowing costs have hit their highest in a generation. Deficits, inflation and a shrinking Fed share the blame